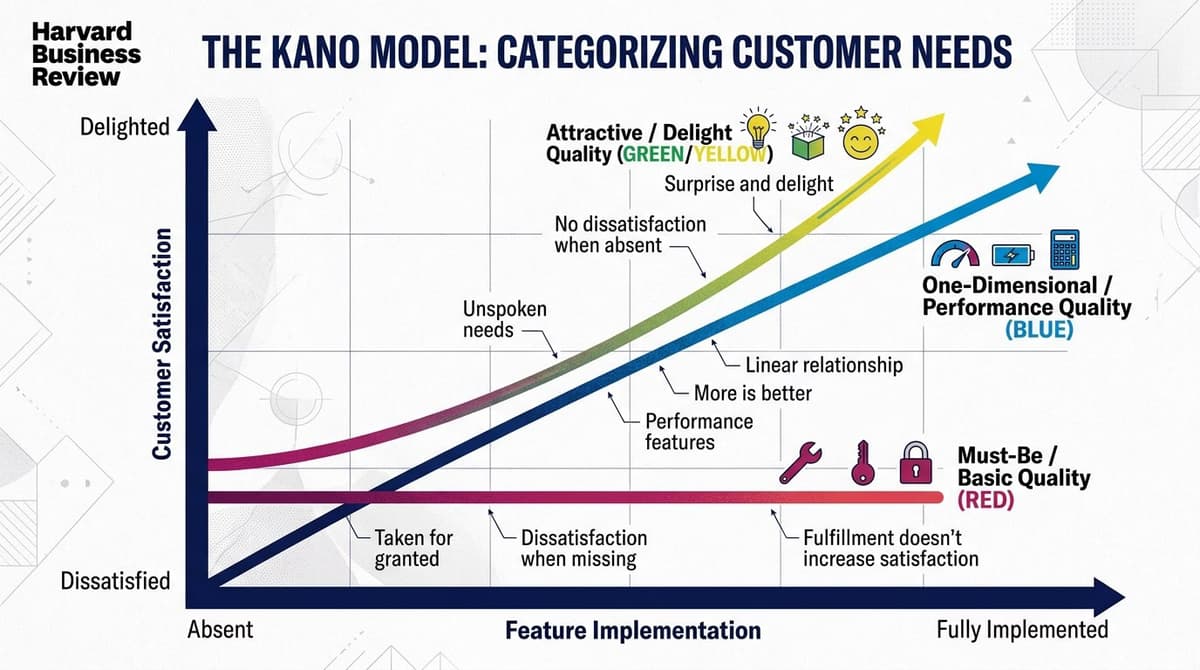
The Kano model is a product feature prioritization framework developed by Noriaki Kano in 1984 at the Tokyo University of Science. It maps each feature along two axes—level of implementation on the X-axis and customer satisfaction on the Y-axis—and classifies them into 5 categories with distinct curves. It's one of the few tools that can distinguish between features that are mandatory, those that differentiate, and those that delight.
In this article, we'll cover the 5 categories, how to conduct a Kano survey with real users, how to apply the results to your roadmap, concrete product examples, and common mistakes to avoid.
The 5 Kano Model Categories
1. Must-be (Basic)
Features that are taken for granted. Their presence doesn't increase satisfaction (users consider them obvious), but their absence causes massive dissatisfaction. The curve is an inverted L: flat at the top right, then plummeting when the feature is missing.
Examples: In a banking app, 'viewing your account balance'; on an e-commerce site, 'seeing product photos'; in a messaging app, 'receiving new message notifications'.
2. Performance (One-dimensional)
Features where more is better. The more you provide, the higher the satisfaction, and the less you provide, the lower it gets. The curve is a rising diagonal line. These are 'linear' features.
Examples: A site's loading speed (faster = happier); the number of movies on Netflix; a smartphone's battery life.
3. Delight (Attractive / Excitement)
Features that users don't expect. Their absence causes no dissatisfaction (nobody asks for them), but their presence generates disproportionate enthusiasm. The curve is exponential: it starts at zero and rises rapidly.
Examples: The first time Slack introduced emoji reactions; when Spotify launched its annual Wrapped review; the first Face ID on the iPhone.
4. Indifferent
Features that nobody cares about. Their presence or absence doesn't move the satisfaction needle. These are features you should NOT build, as they burn resources without creating value.
Examples: Customization options that users never discover; integrations with tools they don't use; advanced settings that remain hidden.
5. Reverse
Features that—surprisingly—reduce satisfaction when present. The more of them you have, the worse it gets. They often emerge in different user segments.
Examples: Excessive push notifications; mandatory sign-up pop-ups; complex menus in a product that is supposed to be simple.

How to Conduct a Kano Survey
The Kano survey is a standardized questionnaire where for each feature, you ask the user two questions:
- Functional question: "How would you feel if this feature were present?"
- Dysfunctional question: "How would you feel if this feature were NOT present?"
The user answers both with 5 options:
- I like it
- I expect it
- I am neutral
- I can live with it
- I dislike it
The combination of the two answers maps the feature into one of the 5 categories using a standard evaluation table published by Kano.
How Many Users Do You Need?
For a statistically significant Kano survey, you need at least 30 responses per user segment, and 50+ for robust results. Below 20, the results are indicative but not actionable. Above 100, the classification tends to stabilize.
Recommended tools: SurveyMonkey, Typeform, or Google Forms with a built-in scoring matrix.
Applying Kano to Your Product Roadmap
Once the features are classified, the priorities become clear:
- First, build all Must-be features. Without them, the product is unacceptable.
- Invest in Performance features: the more, the better. Optimize these within your budget.
- Add 1-2 Delight features per release: too many is ineffective (users get used to them, and they become Performance features), but too few means you lose your competitive edge.
- Scrap the Indifferent features: any resource spent here is wasted.
- Remove Reverse features for the segments where they are problematic.
Real Example: Kano for a Fitness App
A product team is launching a new fitness app. They have 12 candidate features. After a Kano survey with 80 users, they discover:
- Must-be: GPS tracking, calorie counter, workout log
- Performance: GPS accuracy, sync speed, UI quality
- Delight: Shareable social badges, music integration
- Indifferent: Avatar customization options, competitive mode
- Reverse (for the 'casual' segment): Aggressive gamification that casual users find stressful
Roadmap result: Priority 1 goes to the three must-be features (required for the MVP). Priority 2 is optimizing GPS and sync speed. One delighter (social badges) will be included at launch. Avatar customization and competitive mode are removed (not for the initial target segment).
The 4 Common Mistakes
1. Not segmenting users. A feature can be a Delighter for power users and Indifferent for casual users. Without segmentation, your results are just a meaningless average.
2. Letting Delighters become Performance features without noticing. A Delighter (like emoji reactions) eventually becomes a Must-be as competitors copy it. You need to redo your Kano analysis periodically.
3. Making the survey too long. A single Kano survey with more than 15 features will lead to high drop-off rates. Split it into multiple surveys.
4. Confusing 'I want' with 'I would use.' Users often say they want features they'll never actually use. Always combine Kano insights with real usage data from sources like the US Bureau of Labor Statistics or Glassdoor.
Kano vs. Other Prioritization Frameworks
- RICE (Reach × Impact × Confidence ÷ Effort): More quantitative, based on a business case.
- MoSCoW (Must/Should/Could/Won't): Simpler, but less granular.
- Value vs. Effort Matrix: A standard 2x2 grid that misses the 'delight' dimension.
- Kano: Best for understanding the type of value a feature provides, not just its priority.
Best practice: Combine Kano with another framework. Kano tells you what kind of feature it is; RICE or MoSCoW tells you which one to build first.
Frequently Asked Questions
How long does a full Kano survey take?
Questionnaire setup takes 1-2 days, user recruitment 3-7 days, and analysis 1 day. Total time is about 1-2 weeks. For teams with an existing user community via email or in-app, it can be faster (3-5 days total).
Does it work for B2B or just B2C products?
It works exceptionally well for B2B, perhaps even better. B2B decision-makers have more defined expectations (clearer must-haves) and distinct segments. Aim for 30 users per role (e.g., admin, end-user, finance) instead of a single pool.
Can I use it as a junior PM/designer?
Yes, it's one of the most accessible frameworks. The math is simple (a 5x5 evaluation table). The real value comes from the team discussion the survey sparks, not the technical execution.
How often should you redo the Kano analysis?
Every 12-18 months is a reasonable cadence. User expectations evolve, delighters become performance features, and must-haves change (e.g., AI integration went from a delighter to a performance feature in about 18 months).
What if I don't have real users yet?
Use proxies: users of similar products, beta testers recruited from online communities, or competitor's users. The results will be less robust but still useful for prioritizing an MVP. Redo the Kano analysis with real users 6 months after launch.
Next Steps
The Kano Model is a product framework every UX designer should know to collaborate effectively with product managers. To learn systematic user research—from interviews and testing to analysis and synthesis—the User Research Course by CorsoUX covers 9 chapters with 62 lessons and 1:1 mentorship. For the complete path (research + design + writing), check out the Complete UX Design Course.
For other related frameworks, see our guides on Jobs to be Done, UX Metrics, and the Customer Journey Map.